Waspadalah terhadap penipu yang aktif di WA mengatasnamakan Indonesia Investments
21 April 2025 (closed)
Jakarta Composite Index (6,445.97) +7.70 +0.12%
Bank Indonesia Expects USD $600 Million Trade Surplus in April 2014
The Governor of Indonesia’s central bank (Bank Indonesia), Agus Martowardojo, expects that the country’s trade balance will post a surplus of around USD $600 million in April 2014, roughly similar to the surplus that was recorded one month earlier (USD $673 million). The April 2014 surplus would be supported by an improvement in non-oil & gas exports, stable commodity prices (particularly coal and crude palm oil/CPO), as well as the waning influence of the Minerba Act.
Martowardojo said that stable prices of Indonesia’s most important export commodities (coal and crude palm oil) have resulted in increased demand from the country’s main trading partners. The Minerba Act, which was implemented on 12 January 2014, prohibits exports of unprocessed minerals (although under some conditions certain raw minerals are allowed to be exported). Contrary to initial expectation this has not led to a widening of the country’s trade deficit.
Another factor that may be responsible for a trade surplus in April is the declining import of raw materials into Indonesia. The downside of this declining import is that it is a sign that investments in Indonesia are slowing. Slowing investment impacts negatively on general economic growth of Southeast Asia’s largest economy.
Meanwhile, Bank Indonesia reminded the private sector to watch foreign debt. In March 2014, total foreign debt of Indonesia totaled USD $276 billion. About USD $146 billion of this total debt constituted private sector debt. Martowardojo said that the country’s (foreign) debt service ratio increased sharply in the first quarter of 2014 and this should be carefully monitored.
Indonesia's Trade Balance 2014 (in billion US Dollar):
| 2014 | Export | Import | ||||
| Month | Oil & Gas | Non Oil & Gas | Total | Oil & Gas |
Non Oil & Gas | Total |
| January | 2,50 | 11,97 | 14,47 | 3,55 | 11,37 | 14,92 |
| February | 2,73 | 11,90 | 14,63 | 3,46 | 10,33 | 13,79 |
| March | 2,64 | 12,57 | 15,21 | 4,01 | 10,53 | 14,54 |
| Jan-Mar | 7,87 | 36,45 | 44,41 | 11,02 | 32,22 | 43,25 |
Indonesia's Trade Balance 2013 (in billion US Dollar):
| 2013 | Export | Import | ||||
| Month | Oil & Gas | Non Oil & Gas | Total | Oil & Gas |
Non Oil & Gas | Total |
| January | 2,66 | 12,72 | 15,38 | 3,97 | 11,48 | 15,45 |
| February | 2,57 | 12,45 | 15,02 | 3,64 | 11,67 | 15,31 |
| March | 2,93 | 12,09 | 15,02 | 3,90 | 10,99 | 14,89 |
| April | 2,45 | 12,31 | 14,76 | 3,63 | 12,83 | 16,46 |
| May | 2,92 | 13,21 | 16,13 | 3,43 | 13,23 | 16,66 |
| June | 2,80 | 11,96 | 14,76 | 3,53 | 12,11 | 15,64 |
| July | 2,28 | 12,81 | 15,09 | 4,14 | 13,28 | 17,42 |
| August | 2,72 | 10,36 | 13,08 | 3,67 | 9,34 | 13,01 |
| September | 2,41 | 12,29 | 14,70 | 3,72 | 11,79 | 15,51 |
| October | 2,72 | 12,99 | 15,70 | 3,47 | 12,20 | 15,67 |
| November | 2,77 | 13,17 | 15,94 | 3,70 | 11,21 | 15,15 |
| December | 3,41 | 13,58 | 16,98 | 4,22 | 11,24 | 15,46 |
| Jan-Dec | 32,63 | 149,93 | 182,57 | 45,27 | 141,36 | 186,36 |
Source: Statistics Indonesia
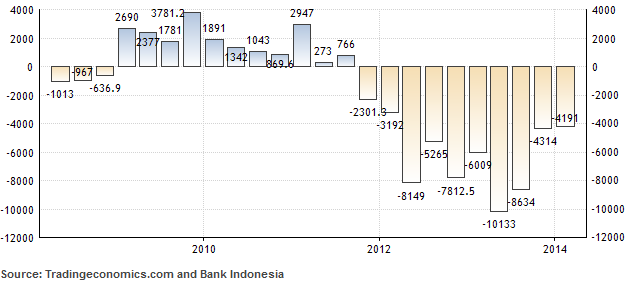
Current Account of Indonesia (USD Million)

Bahas
Silakan login atau berlangganan untuk mengomentari kolom ini


